Lesson 24 Creating Charts and Graphs
Continue learning Excel VBA 365 with the same shared lesson template and cleaner visual style.
In Excel VBA 365, we can write code to create charts and graphs easily based on the data on the spreadsheet. Excel VBA 365 has made charting engine as part of the Shape object. It is also an object by itself. We can create charts on a worksheet of their own or embed them into an existing worksheet. The chart sheet is the Chart object whereas the embedded chart is part of the shape collection for the worksheet.
24.1 Creating a Pie Chart
To create a pie chart in a spreadsheet, first of all, you need to enter a range of data in a spreadsheet. After entering the data, you can name the range by right-clicking the range and clicking defines name in the pop-up menu. Name the chart MyChart. If you don't name the range, you must define the range in the code. The code to select the range is as follows:
ActiveChart.SetSourceData Source:=Range("Cells(i):Cells(j)")
For example:
ActiveChart.SetSourceData Source:=Range("b2:e10")
Or
ActiveChart.SetSourceData Source:=Range("Chart Name")
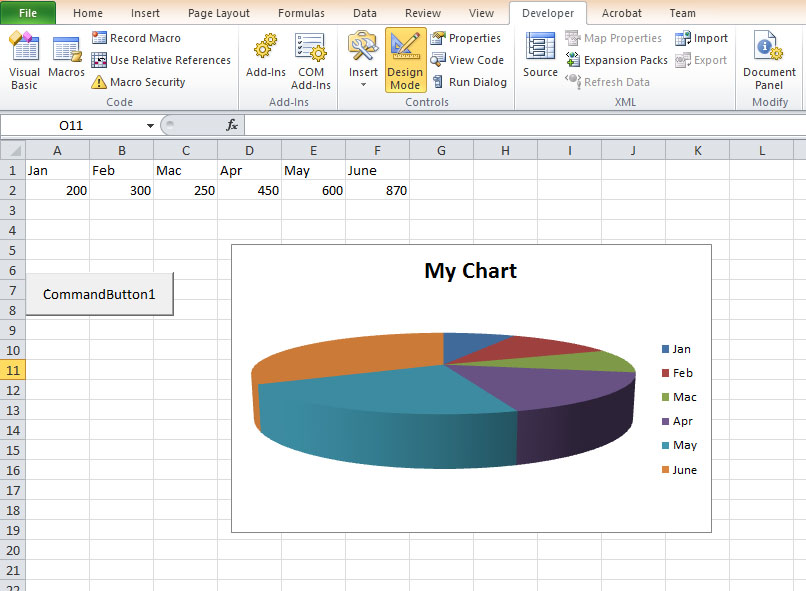
Now insert a command button and then click it to enter the following code in the Excel VBA 365 editor
Private Sub CommandButton1_Click()
 ActiveSheet.Shapes.AddChart.Select
 ActiveSheet.Shapes(1).Top = 10
 ActiveSheet.Shapes(1).Left = 10
 ActiveChart.ChartType = xl3DPie
 ActiveChart.PlotArea.Select
 ActiveChart.SetSourceData Source:=Range("MyChart")
 ActiveChart.HasTitle = True
 ActiveChart.ChartTitle.Text = "My Chart"
End Sub
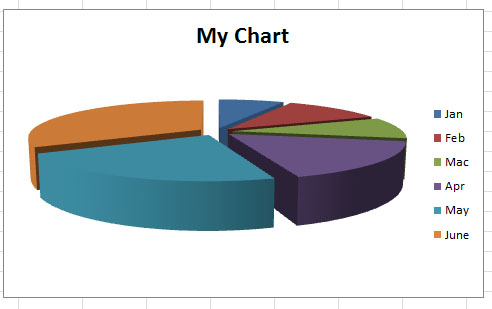
To separate the pie chart into slices (The technical term is explode), change the ChartType to xl3DPieExploded.
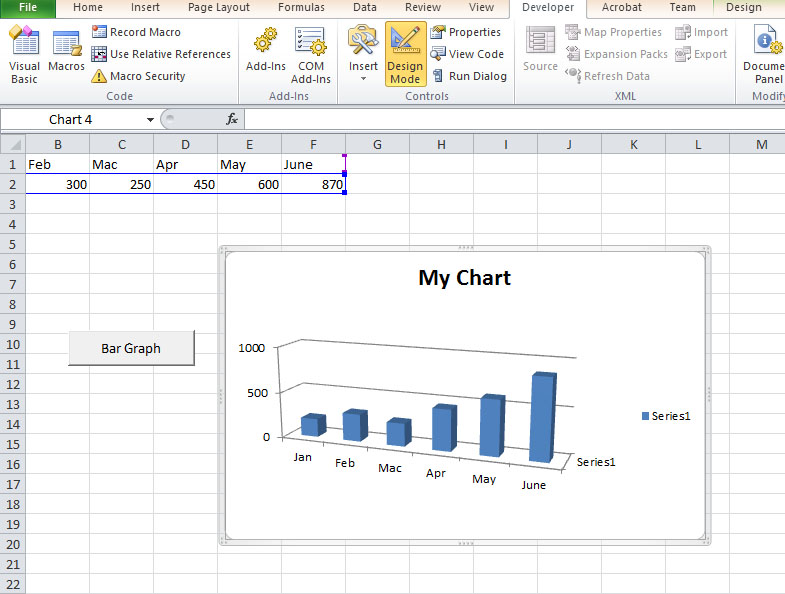
24.2 Creating a Bar Chart
To draw a bar Chart, you just need to change the ChartType to xl3DColumn.
Private Sub CommandButton2_Click()ActiveSheet.Shapes.AddChart.Select
 ActiveSheet.Shapes(1).Top = 10
 ActiveSheet.Shapes(1).Left = 10
 ActiveChart.ChartType = xl3DColumn
 ActiveChart.PlotArea.Select
 ActiveChart.SetSourceData Source:=Range("MyChart")
 ActiveChart.HasTitle = True
 ActiveChart.ChartTitle.Text = "My Chart"
End Sub
Excel VBA 365 has built-in parameters to define the types of charts that can be drawn on a spreadsheet. You can refer to the parameters as the ChartType properties. The list of common properties for ChartType are listed below:
| Property | Chart Type |
|---|---|
| xlArea | Area Chart |
| xlBar | Bar Chart |
| xlColumn | Column Chart |
| xlLine | Line Chart |
| xl3DLine | 3D Line Chart |
| xlPie | Pie Chart |
| xlXYScatter | XY Scatter Chart |
| xl3DArea | 3D Area Chart |
| xl3DBar | 3D Bar Chart |
| xl3DColumn | 3D Column Chart |
| Xl3DLine | 3D Line Chart |
For a complete list of ChartType, please refer to List of Excel ChartType.
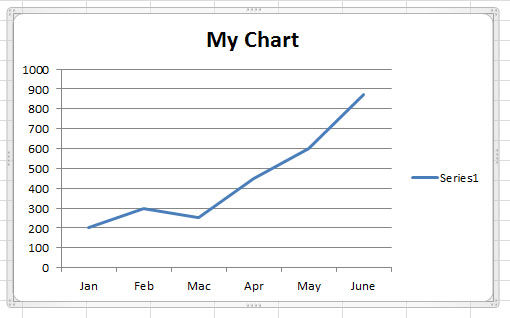
24.3 Drawing a Line Chart
To draw a , use the ChartType property xlLine ,as follows:
ActiveChart.ChartType = xlLine
you will obtain a line graph as follows:
Private Sub CommandButton2_Click()ActiveSheet.Shapes.AddChart.Select
 ActiveSheet.Shapes(1).Top = 10
 ActiveSheet.Shapes(1).Left = 10
 ActiveChart.ChartType = xlLine
 ActiveChart.PlotArea.Select
 ActiveChart.SetSourceData Source:=Range("MyChart")
 ActiveChart.HasTitle = True
 ActiveChart.ChartTitle.Text = "My Chart"
End Sub
A final note. To delete the charts, use the following code:
Worksheets("Sheet1").ChartObjects.Delete