This is a chart drawing app to assist users in creating customized charts in Excel 365 worksheet. In Excel VBA 365, we can write code to create charts and graphs easily based on the data on the spreadsheet.
Excel VBA 365 has made charting engine as part of the Shape object. It is also an object by itself. We can create charts on a worksheet of their own or embed them into an existing worksheet. The chart sheet is the Chart object whereas the embedded chart is part of the shape collection for the worksheet.To create this chart drawing app, start a new Excel VBA 365 worksheet. Next, click on the Developer tab to launch the Excel VBA design environment. Insert three command buttons, one is for the user to enter the customized range, another one is to draw the chart and the final one is to clear charts.
Besides that, insert 6 option buttons to let the user select the type of chart he or she wants to draw.
The type of chart we can draw depends on the ChartType attributes(properties). The list of ChartType attribites is as shown in the table below:
| Property | Chart Type |
|---|---|
| xlArea | Area Chart |
| xlBar | Bar Chart |
| xlColumn | Column Chart |
| xlLine | Line Chart |
| xl3DLine | 3D Line Chart |
| xlPie | Pie Chart |
| xl3DPieExploded | Exploded 3D Pie Chart |
| xl3DBarStacked | 3D Stacked Bar Chart |
| xlXYScatter | XY Scatter Chart |
| xl3DArea | 3D Area Chart |
| xl3DColumn | 3D Column Chart |
| xl3DLine | 3D Line Chart |
| xlBubble | Bubble Chart |
For a complete list of ChartType, please refer to List of Excel ChartType.
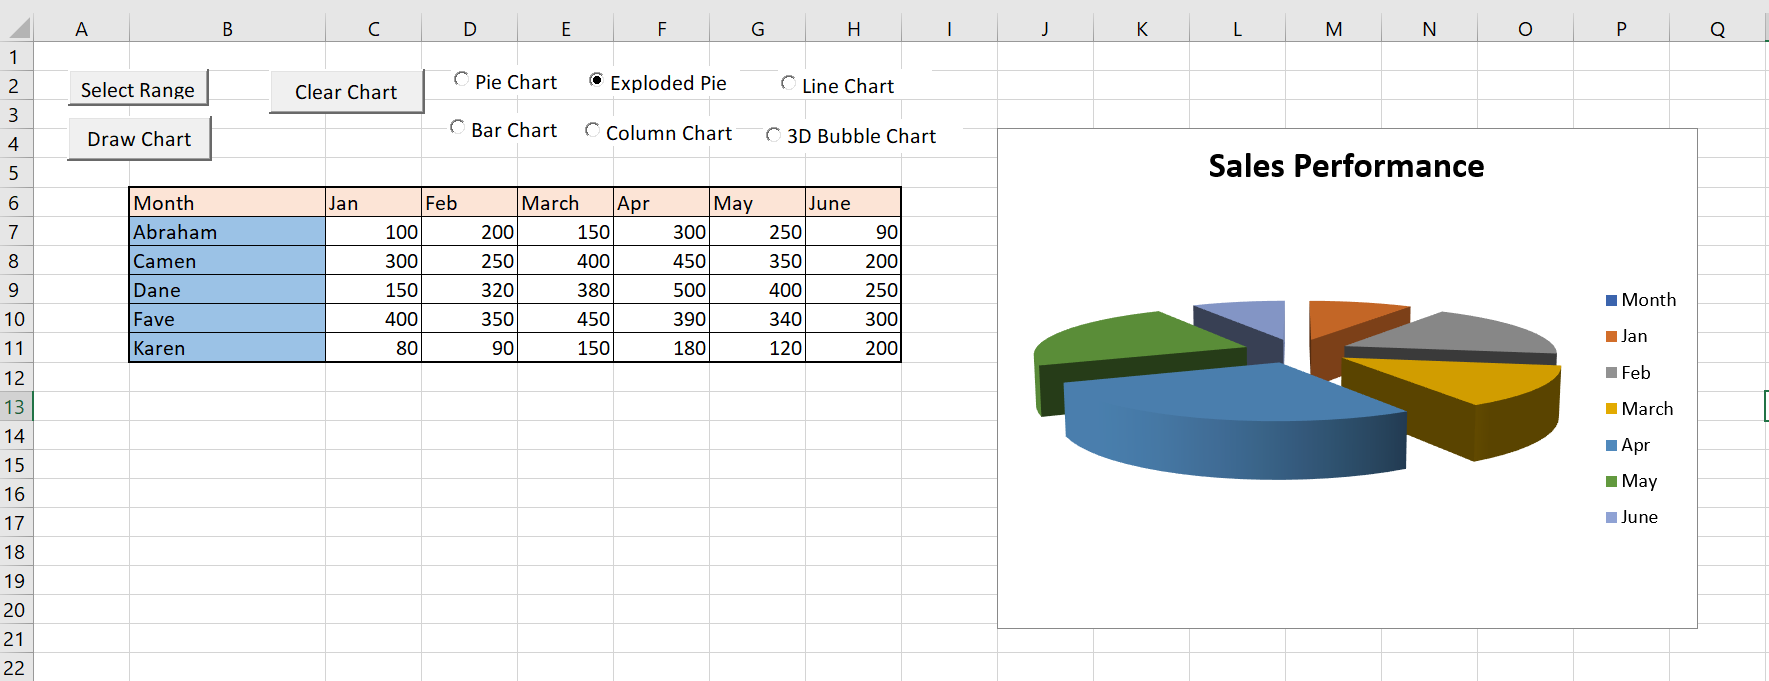
The next step is to create a table with some hypothetical data. In our example,we call it a sales performance table. The design UI is as shown in the figure blow:
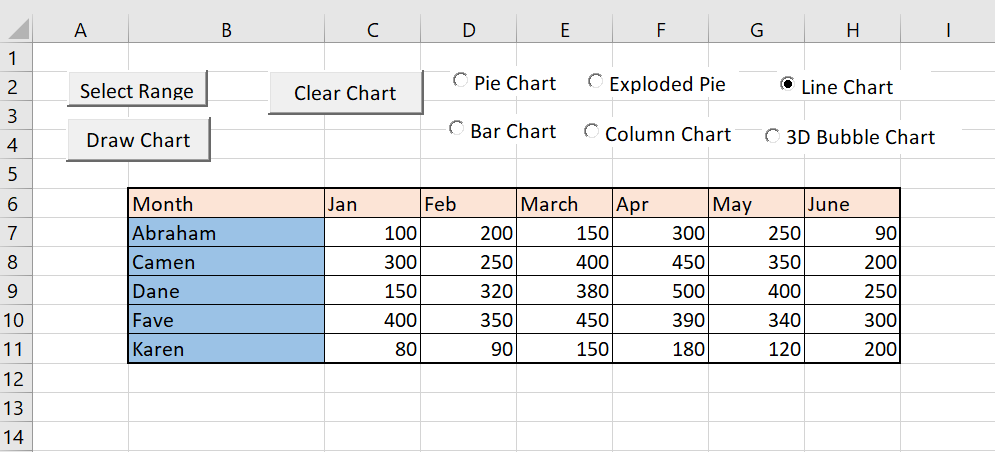
We create a sub procedure to let user enter the range of data via an InputBox.
Static Sub selectRng()
rng = InputBox("Enter the range, eg. a1:e12")
End Sub
This sub procedure will be called when the user clicks the Select Range command button. The code is as follows:
Static Sub Cmd_SelectRng_Click()
selectRng
End Sub
In the general section of the code, we define two variables, rng and ctype. rng is for accepting the range value input by the user and ctype is to accept different values of ChartType
Sub draw()
ActiveSheet.Shapes.AddChart.Select
ActiveChart.ChartType = ctype
ActiveChart.PlotArea.Select
ActiveChart.SetSourceData Source:=Range(rng)
ActiveChart.HasTitle = True
ActiveChart.ChartTitle.Text = "Sales Performance"
End Sub
Private Sub Cmd_DrawChart_Click()
If Opt_Pie.Value = True Then
ctype = xlPie

ElseIf Opt_ExplodePie.Value = True Then

ctype = xl3DPieExploded
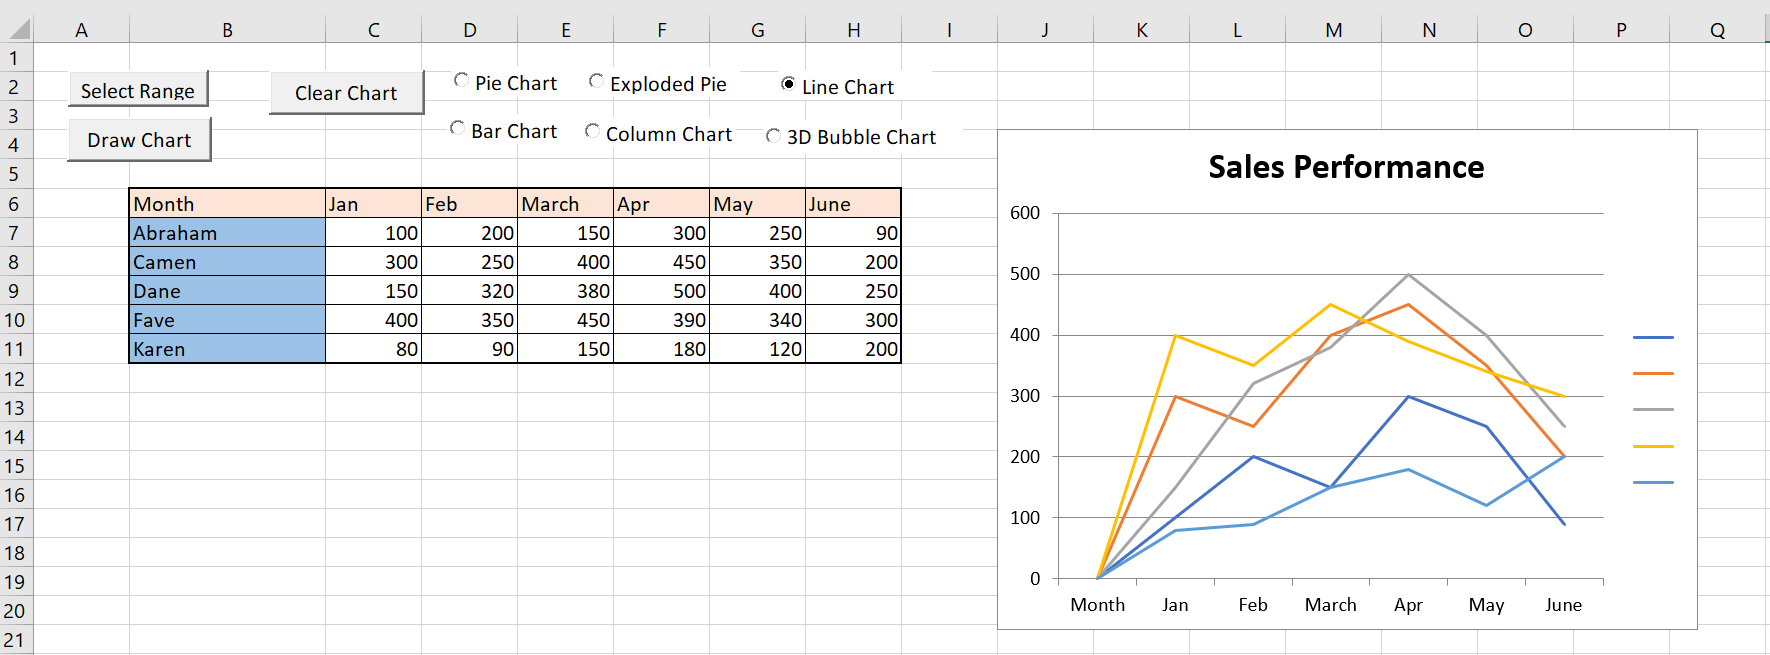
ElseIf Opt_Line.Value = True Then

ctype = xlLine
ElseIf Opt_Bar.Value = True Then

ctype = xlBarStacked
ElseIf Opt_ColumnChart.Value = True Then

ctype = xlColumnStacked
Else
ctype = xlBubble3DEffect
End If

draw

With ActiveChart.Parent
'To position the chart
    .Top = Range("J4").Top
    .Left = Range("J10").Left
'define the height of the chart
    .Height = 250
    .Width = 350

End With
End Sub
Private Sub Cmd_ClearChart_Click()
Worksheets("Sheet1").ChartObjects.Delete
End Sub
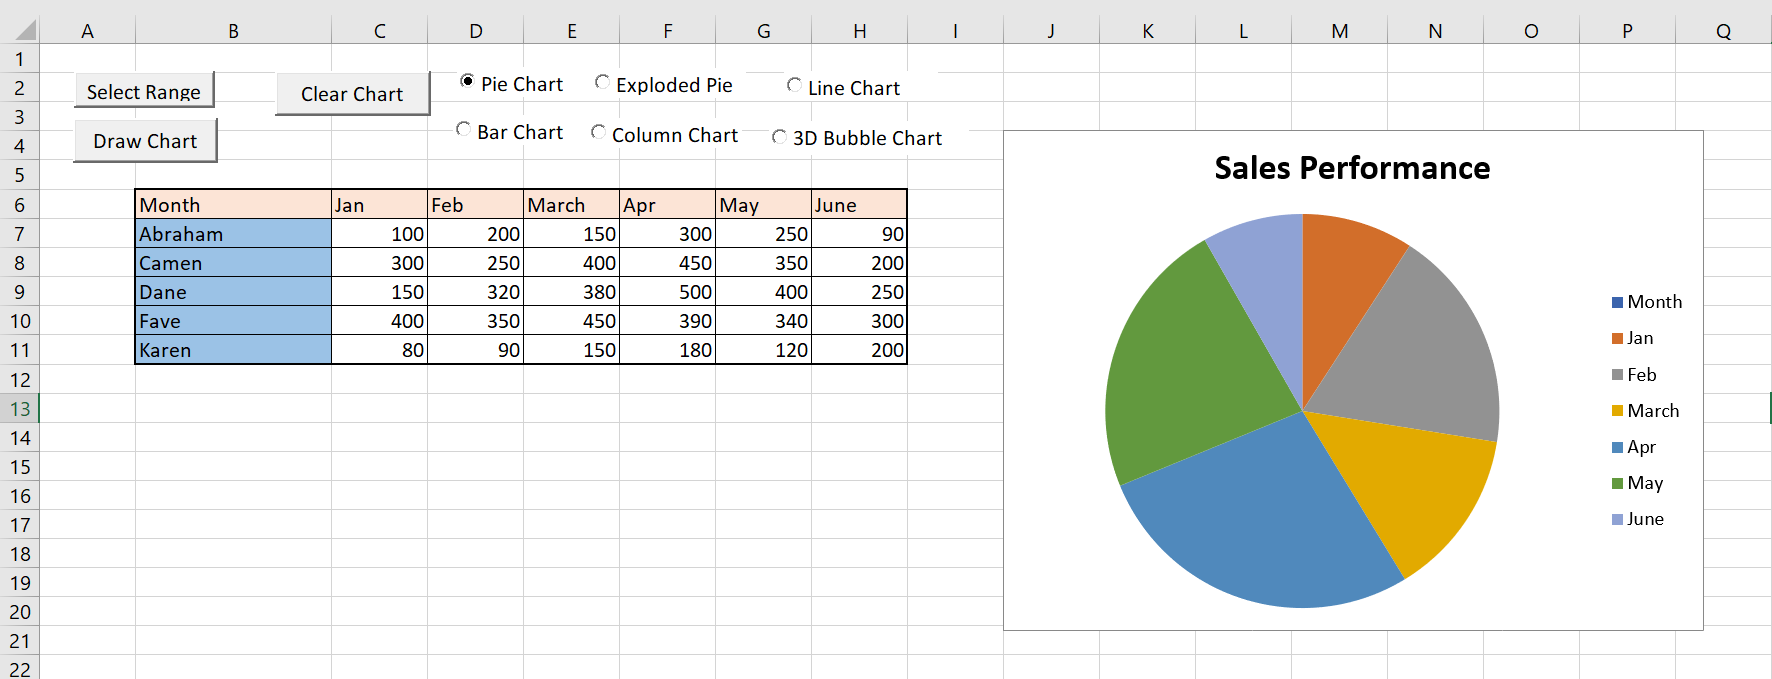
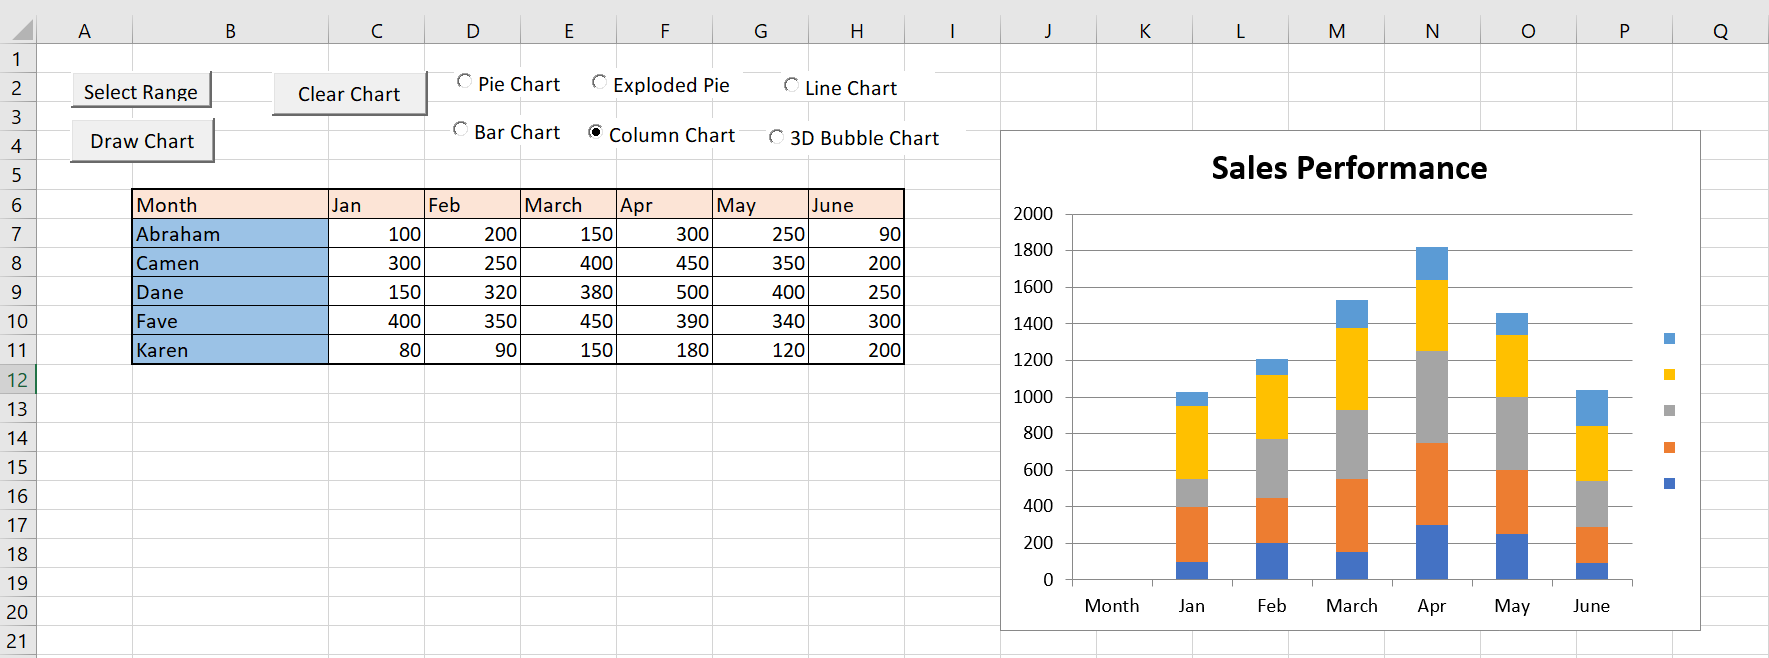
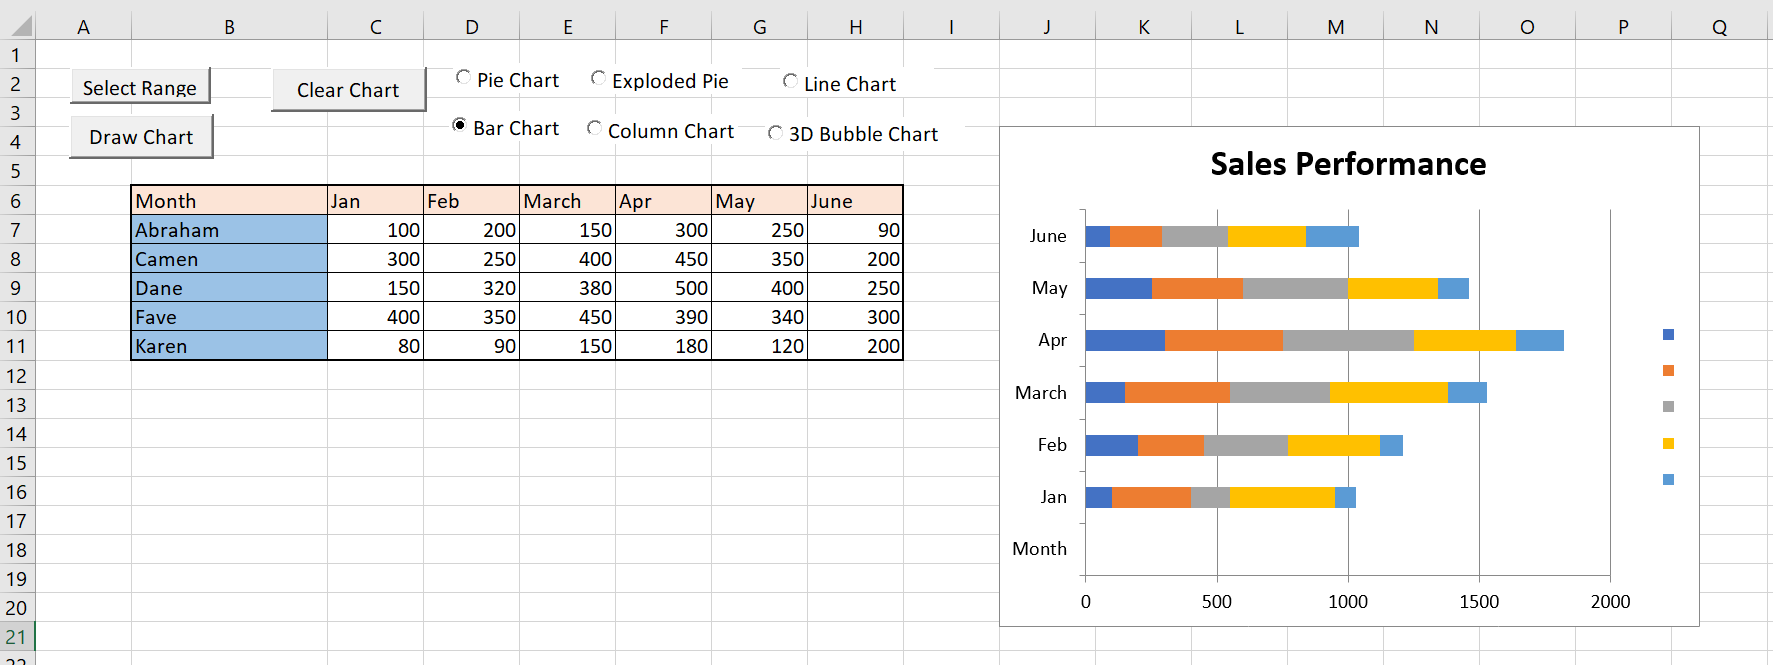
Copyright ® 2008 Dr.Liew Voon Kiong . All rights reserved [Privacy Policy]
Contact: Facebook Page